These three alternative cryptocurrencies showcase optimistic patterns against Bitcoin (BTC) and have the potential to outperform it in February.
Despite the decline in Bitcoin’s value since January 14, these alternative cryptocurrencies are showing promising price increases. Will they surpass BTC in performance during February?
Chainlink (LINK) Price Overcomes Long-Term Resistance and Breaks Through
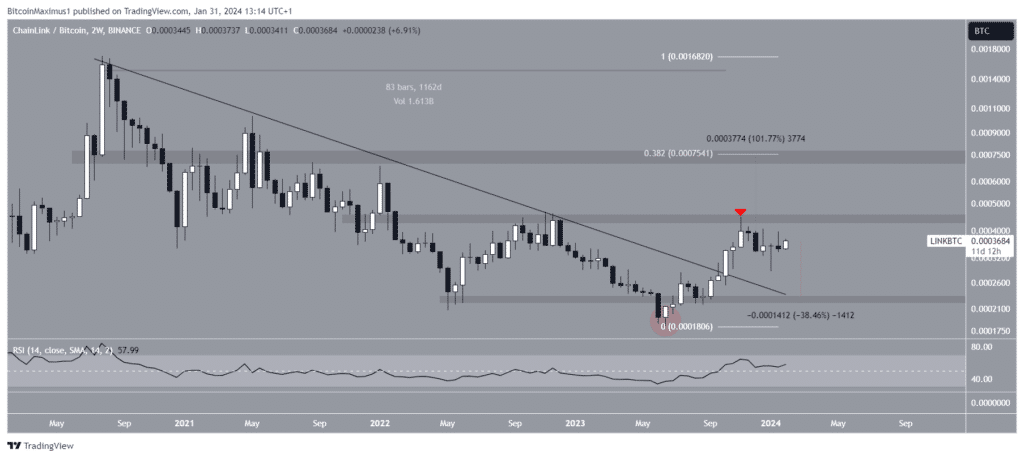
In the weekly time frame technical analysis, it is observed that the LINK price has experienced a decline below a descending resistance trend line starting from June 2020. In June 2023, there was a significant decline, resulting in a low of ₿0.00018.
Although the movement appeared to result in a breakdown from the support area at $0.00023, LINK quickly reclaimed it, transforming the decrease into a deviation (red circle).
The price of LINK experienced a significant breakout from the trend line after more than 1,100 days, reaching a peak of ₿0.00045 in November before subsequently declining. The subsequent decline confirmed the ₿0.00042 level as a barrier.
Despite the decline, LINK quickly recovered and is now making another attempt to break out. If the outcome is favorable, the price has the potential to surge by 100% and reach the next resistance level at ₿0.00075.
The RSI confirms the bullish trend on a daily basis. The Relative Strength Index (RSI) is a momentum indicator that traders use to determine whether a market is overbought or oversold and when it is appropriate to buy or sell an asset.
When the relative strength index (RSI) reading is greater than 50, and the trend is moving upward, the bulls continue to hold the upper hand. If, on the other hand, the reading is lower than fifty, the situation is entirely different. At the moment, the Relative Strength Index (RSI) is higher than 50 and exhibiting an upward trend. Having a positive outlook is indicated by both.

In spite of this optimistic LINK price forecast, if it fails to surpass ₿0.00042, it could potentially lead to a significant 40% decline towards the nearest support level at ₿0.00022.
Completion of Accumulation for Frax Share (FXS)
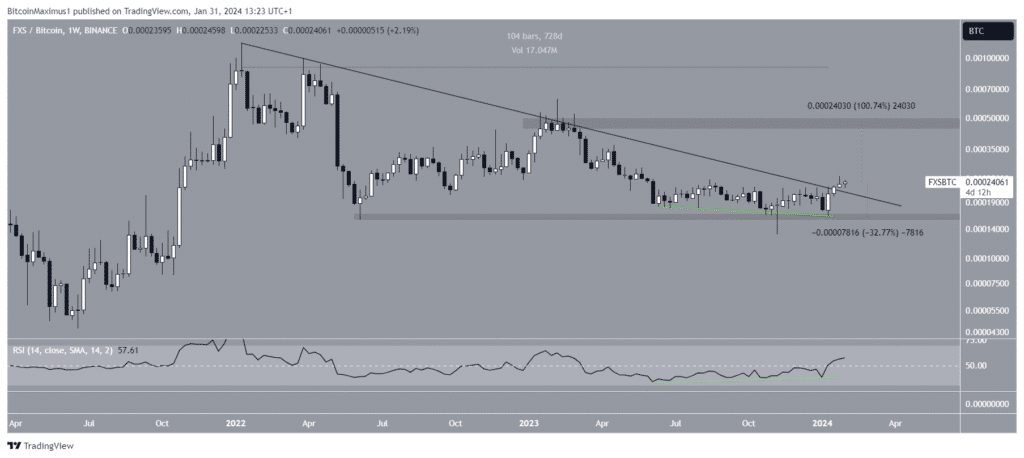
The price of FXS experienced a decline below a downward resistance trend line after reaching its highest price of ₿0.0012 in early 2022. The trend line was confirmed multiple times, resulting in a decline to ₿0.00013 in November 2023.
The cost has risen since and surpassed the trend line a fortnight ago. By that point, the trajectory had remained consistent for almost two years.
Prior to the breakout, the weekly RSI exhibited bullish divergence for a period exceeding six months. This kind of deviation is uncommon and frequently results in a reversal of the bullish trend.
If the upward trend in FXS persists, the price could reach the resistance level of ₿0.00048, which is significantly 100% higher than the current price.

In contrast to this optimistic FXS price forecast, if the resistance trend line is breached and a weekly close occurs below it, a significant 30% decline to ₿0.00016 is possible.
The Cryptocurrency Ethereum (ETH) Creates a Bullish Divergence
ETH is the ultimate alternative cryptocurrency that has the potential to surpass BTC.
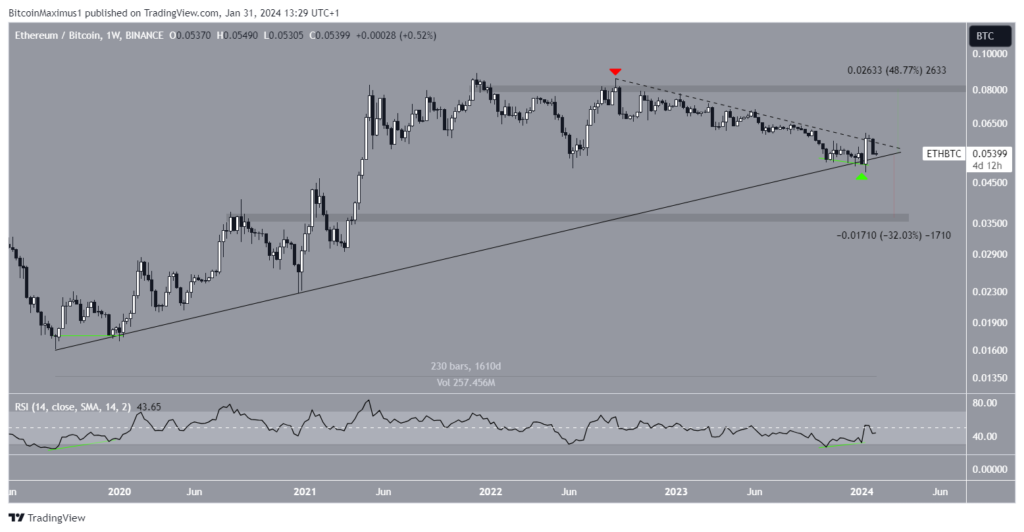
The price of ETH has been on the rise, following an upward trend line of support for a remarkable 1,600 days. In more recent times, the trend line received confirmation in early January (green icon), resulting in a significant bullish candlestick.
Curiously, the weekly RSI produced a bullish divergence and ventured beyond its oversold region. In the past, ETH caused quite a split when the upward trend began.
The price of ETH is poised to validate its bullish trend reversal as it surpasses the descending resistance trend line (dashed). Afterward, it has the potential to surge by 50% and reach the subsequent resistance level at ₿0.08.

In light of the optimistic forecast for ETH, should the weekly closing fall below the upward support trend line, it may prompt a significant 30% decline toward the nearest support level at ₿0.036.


