

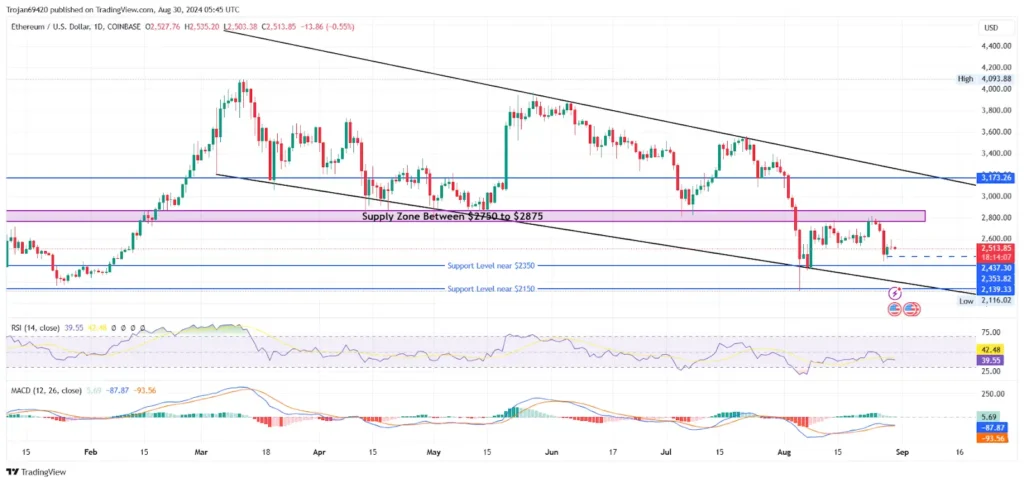
On the daily chart, the price movement of Ethereum shows a significant descending channel pattern in progress. Commencing from the support trendline close to the $2350 support level, the bull cycle encounters difficulties in surpassing the $2800 supply zone.
In addition, the inability of the market to overcome this resistance led to a significant decline over three days, causing a decrease in price by 11.22%. Nevertheless, the substantial increase of 2.86% observed on Wednesday indicates the prevailing bullish sentiment at the $2400 level.
However, the price of Ethereum is facing difficulties in surpassing the upward trend beyond the significant $2500 level. Following a decline of 0.44% during the day, the pullback is anticipated to strengthen due to the increased rejection of higher prices observed in yesterday’s candlestick.
The price of Ethereum has experienced a significant correction, resulting in a decrease of 4.47% over the past seven days and a drop of 23.98% over the past 30 days. In contrast to the previous year, the price of Ethereum has experienced a significant increase of 48%, demonstrating a growth of 10.82% since the beginning of the year.

On the 4-hour chart, the inability of the bulls to surpass the supply zone at $2800 indicates a breakdown in the rising wedge pattern. The ascending wedge is created when two trend lines come together, forming a narrow path and a decreasing range within an upward trend.
Although there is a formation of a higher low, the price of the asset is facing difficulty in reaching new highs, leading to the formation of a resistance trend line. The breakdown extends the unfavorable cycle with the recent bearish reversal from the upper trend line.
As a pattern that indicates the continuation of a trend, the breakdown of the rising wedge signals a potential bearish trend toward the following support levels. Ethereum has additional support levels at $2350 and $2150.
On August 28, there was a remarkable increase in investments in the U.S. Ethereum spot ETFs, totaling $5.8 million. Thursday concluded on a positive note, putting an end to the nine days of outflows in Ethereum ETFs. The net inflow of $5.8 million comprises BlackRock’s (ETHA) $8.4 million and Fidelity’s (FETH) $1.3 million.
Grayscale’s Ethereum Trust (ETHE) has experienced a significant outflow of $3.8 million, indicating a need for more momentum in its growth. Nevertheless, this marks the smallest amount of outflow since it first appeared on July 23.
Blackrock’s ETHA, the leading Ethereum ETF, has attracted over $1 billion in new investments, while FETH and Bitwise Ethereum ETF (ETHW) have seen inflows of $392.9 million and $314.1 million, respectively. Remarkably, Grayscale’s Ethereum Mini Trust (ETH) has seen an impressive influx of $235.6 million since it was introduced.
On August 29, however, it was a relatively uneventful day in terms of ETH ETF fund activity. The only notable movement was Grayscale Trust, which continued to experience a negative flow of $5.3 million.
Even though there have been significant outflows from Grayscale worth $2.55 billion, the Ethereum ETF market has still managed to reach a peak of $475.7 million in net flows. In fact, Ethereum ETFs have attracted over $2 billion in inflows.
With net flows taking a positive turn, market participants are anticipating a significant boost in Ethereum sentiment. Nevertheless, the current price movement tells a contrasting tale.
Is Ethereum Expected to Experience a Bullish Trend?
According to the RSI indicator on both the daily and 4-hour charts, Ethereum’s bull cycle is encountering significant supply pressure. In spite of the recovery from the oversold territory, the RSI is unable to sustain the pattern as the bearish momentum gradually intensifies.
The MACD indicator on the daily chart indicates a potential shift towards a bearish trend as the average lines are about to cross into negative territory. Therefore, the momentum indicators indicate a downward trend, but the long-term speculation suggests optimistic projections for Ethereum.
Despite the market’s volatility and the inability of a bullish trend to hold, the Ethereum ETF’s positive inflows are unable to improve the overall sentiment.
Although there may be a potential double bottom forming around $2437, it is essential to note the significance of a bullish divergence in the RSI.
As long as the $2437 support holds strong, there is little concern regarding the critical support levels around $2350 and $2150.